(Editor’s note: Part 1 appeared yesterday and can be accessed here.)
By Vasily Yamaletdinov, Principal Consultant, Zühlke Group
Measuring Complexity
Despite the prevalence of the term “complexity”, today there is no agreed definition for it, both in general and in the context of IT landscape architecture management. The Cambridge Dictionary, for example, defines complexity as “the quality of having many connected parts and being difficult to understand”. The literature on this topic offers the widest range of concepts and ways to measure the level of complexity.
At the same time, the growth of complexity is becoming one of the key factors in the manageability of the IT landscape, and, as you know, “If you can’t measure it, you can’t manage it.”
Attempts to measure the complexity of the IT landscape in large companies today usually come down to counting:
- number of applications.
- number of information flows between applications.
- percentage of applications compliant with standards.
- number of infrastructure components used by applications.
- scope of application functionality.
- level of redundancy of functionality in applications.
Even though these metrics are intuitive and even to a certain extent allow predicting costs, at the same time they do not allow us to derive a plausible integral indicator of the complexity of the IT landscape based on them and have no theoretical justification from the point of view of systems theory.
Peter Senge suggests that system complexity exists in two main forms:
- Structural complexity arises because of a large number of systems, system elements and established relationships in any of the two main topologies (hierarchy or network). This complexity has to do with systems as they are; namely, with their static existence.
- Dynamic complexity is related to the relationships that arise between ready-made, functioning systems in the course of their work, that is, between the expected and even unexpected behavior that actually occurs.
Seth Lloyd collected some examples of quantitative measures of complexity, which he attributed to attempts to answer three questions:
- How hard is it to describe? This is usually measured in bits of information used to represent the description. Examples measures: Information; Entropy; Algorithmic Complexity or Algorithmic Information Content, etc.
- How hard is it to create? Typically measured in time, energy, cost, etc. Measure examples: Computational Complexity; Time Computational Complexity; Space Computational Complexity, Cost, etc.
- What is its degree of organization? This topic can be divided on two types of metrics:
- Difficulty of describing organizational structure, whether corporate, chemical, cellular, etc. (Effective complexity). Examples measures: Metric Entropy; Fractal Dimension; Excess Entropy; Stochastic Complexity, etc.
- Amount of information shared between the parts of a system as the result of this organizational structure. (Mutual information). Examples measures: Algorithmic Mutual Information; Channel Capacity; Correlation; Stored information; Organization.
There are also concepts that are not in themselves quantitative measures of complexity but are very close to them: Long-Range order; Self-Organization; Complex Adaptive systems; Edge of Chaos.
In relation to the IT landscape, the most interesting are metrics related to the assessment of the structural complexity of the system based on heterogeneity and topology.
So, Alexander Schütz et al. proposed to use the number and heterogeneity of its components and their connections as a measure of the complexity of the IT landscape, where heterogeneity is a statistical property and refers to the diversity of attributes of elements in the IT.
Schütz applied the concept measures concentration, especially Shannon Entropy, for quantitative evaluation of heterogeneity:
![]()
, where n denotes the number of diverse technical flavors (e.g., the number of different operating systems in use) and pi denotes the relative frequency of a certain flavor i (e.g., the number of instances for operating system type i).
This approach allowed the authors to derive 10 quantitative IT landscape complexity metrics based on heterogeneity:
- Application Type Complexity – number and heterogeneity of domain application customization levels (make, buyAndCustomize, buy).
- Business Function Complexity – number and heterogeneity of business functions supported by a domain’s applications.
- Component Category Complexity – number and heterogeneity of infrastructure components of a given component category (OS, DBMS, etc.).
- Coupled Domain Complexity – number and heterogeneity of the functional domains with which the selected domain is coupled, where the coupling of the domains is determined by their applications and information flows.
- Database Complexity – the number and heterogeneity of DBMS used by a domain’s applications.
- Interface Implementation Complexity (Application) – number and heterogeneity of the technical implementations of an application’s information flows.
- Interface Implementation Complexity (Domain) – the number and heterogeneity of technical implementations of information flows of a domain’s applications.
- Operating System Complexity – the number and heterogeneity of OS used by a domain’s applications.
- Operating System Types Complexity – the number and heterogeneity of OS types (vendor and version) used by an application.
- Programming Languages Complexity – the number and heterogeneity of programming languages the applications of a domain based on.
Domains here are understood as business functions of the enterprise (lending, deposits, HR , risks, marketing, purchases, etc.).
Another method for measuring the complexity of the IT landscape – based on topology – was proposed by Robert Lagerström using approach widespread in the software architecture – Design Structure Matrix (DSM) – for visualization hidden structure of the IT landscape and revealing spots of elevated complexity.

Figure 1. Design Structure Matrix.
The method used for architecture network representation is based on and extends the classic notion of coupling. Specifically, after identifying the coupling (dependencies) between the elements in a complex architecture, the method analyzes the architecture in terms of hierarchical ordering and cycles, enabling elements to be classified in terms of their position in the resulting network.
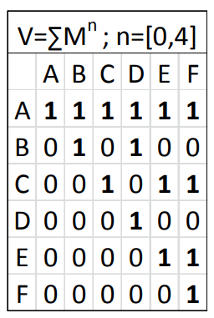
If the first-order matrix is raised to successive powers, the result will show the direct and indirect dependencies that exist for successive path lengths. Summing these matrices yields the visibility matrix V, which denotes the dependencies that exist for all possible path lengths.

Figure 2. Visibility Matrix.
Further, for each application of the IT landscape, the following metrics are calculated in the V matrix:
- Visibility Fan-In (VFI) – the number of applications that explicitly or implicitly depend on the current application.
- Visibility Fan-Out (VFO) – the number of applications on which the current application explicitly or implicitly depends.
To measure visibility at the level of the entire IT landscape, the Propagation Cost is defined as the density of the visibility matrix. Intuitively, the propagation cost is equal to the proportion of the architecture affected by the change in a randomly selected element (i.e., in essence, this is the sensitivity of the IT landscape to changes). It can be calculated from VFI or VFO:

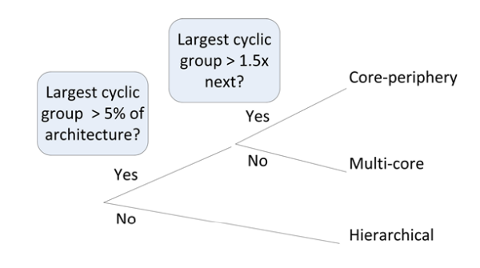
The next step is to look for cyclic groups in the IT landscape. Every element within a cyclic group is directly or indirectly dependent on every other member of the group. The found cyclic groups are called “cores” of the system. The largest cyclic group (the “Core”) plays a special role in the architectural classification scheme of the IT landscape.
Further, based on the topology of the IT landscape, i.e. applications and their dependencies, the type of its architecture is determined (core-periphery, multi-core or hierarchical). All IT landscape applications, based on their FVI and VFO, are divided into core, control, shared and periphery. Core applications are defined as the largest group of applications with cyclic dependencies. Control applications have more outbound dependencies while shared apps have more inbound dependencies. Periphery applications have both fewer inbound and fewer outbound dependencies compared to the core. Especially shared and core applications are expected to require higher cost/effort when they need to be modified due to their number of transitive dependencies.

Figure 3. IT landscape topology classification.
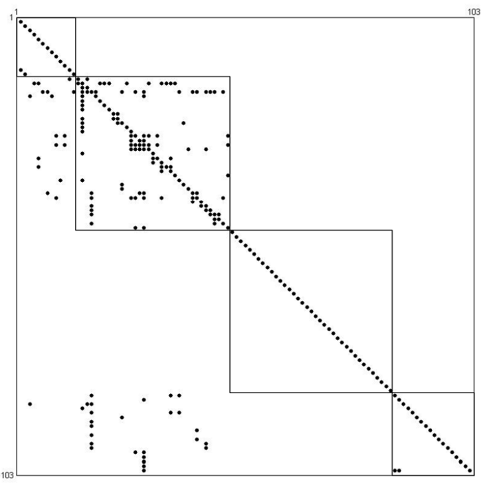
Using the classification scheme above, it is possible to build a reorganized DSM that exposes the “hidden structure” of the IT landscape architecture by placing elements in the order of Shared, Core, Periphery, and Control down the main diagonal of the DSM, and then sorting within each group in descending VFI, then ascending VFO.

Figure 4. Hidden Structure Example.
Unlike other indicators of complexity, coupling and modularity, this “hidden structure” method takes into account not only the direct network structure of the architecture, but also indirect dependencies between applications, which makes an important contribution to decision-making.
Conclusions
Understanding that in the case of the IT landscape we are dealing not with a conventional system, but with a complex system of systems (SoS), allows us to draw the following important conclusions:
- Engineering of IT landscapes, especially “Acknowledged” and “Collaborative” ones, must take into account all 7 main characteristics of SoS, so the basic tools of classical systems engineering may not be enough here.
- The particular importance of the managerial aspect (issues of ownership of subsystems, conflict resolution in the chains of creator systems, and Conway’s law), and not just technical solutions, must be considered when developing the IT landscape.
- Structuring the IT landscape using platforms and the interaction of its subsystems based on standardized APIs can reduce its complexity, effectively find consensus in conflicts between creator systems, and increase the level of reuse of IT assets in target business systems.
- Measuring the complexity of the IT landscape and countering its increase should be one of the company’s strategic priorities.
- It must be remembered that for all its complexity, the IT landscape is just one of the subsystems-creators (enabling system) within an even more complex system of systems – organizations.
There is ongoing active research into SoS and system complexity, including the IT landscape, at various corporations, universities, and government agencies in the US and Europe. Perhaps in the near future there will be more efficient and developed mathematical methods, the use of which will help reduce the complexity of IT landscapes, and consequently, reduce the cost of ownership of IT assets, reduce the risks of security and business continuity breaches, as well as reduce Time-To- Market when releasing new products.
References
- Levenchuk “Practical systems thinking – 2023”.
- Kossiakoff, W. Sweet , S. Biemer , S. Seymour “Systems engineering . Principles and practice”.
- Lloyd “Measures of Complexity a non-exhaustive list”.
- Schneider, T. Reschenhofer, A. Schütz, F. Matthes “Empirical Results for Application Landscape Complexity”.
- Lagerström, C. Baldwin, A. MacCormack, S. Aier “Visualizing and Measuring Enterprise Application Architecture: An Exploratory Telecom Case”.
Zühlke is a global innovation service provider that empowers ideas and creates new business models by developing services and products based on new technologies – from initial vision through development, deployment, production, and beyond.
